To my delight, I can now announce that the next Digital Humanities Working Group at UC Berkeley is November 4 at 1pm in Doe Library, Room 223.
For the workshop, we have two amazing speakers for lightning talks. They are:
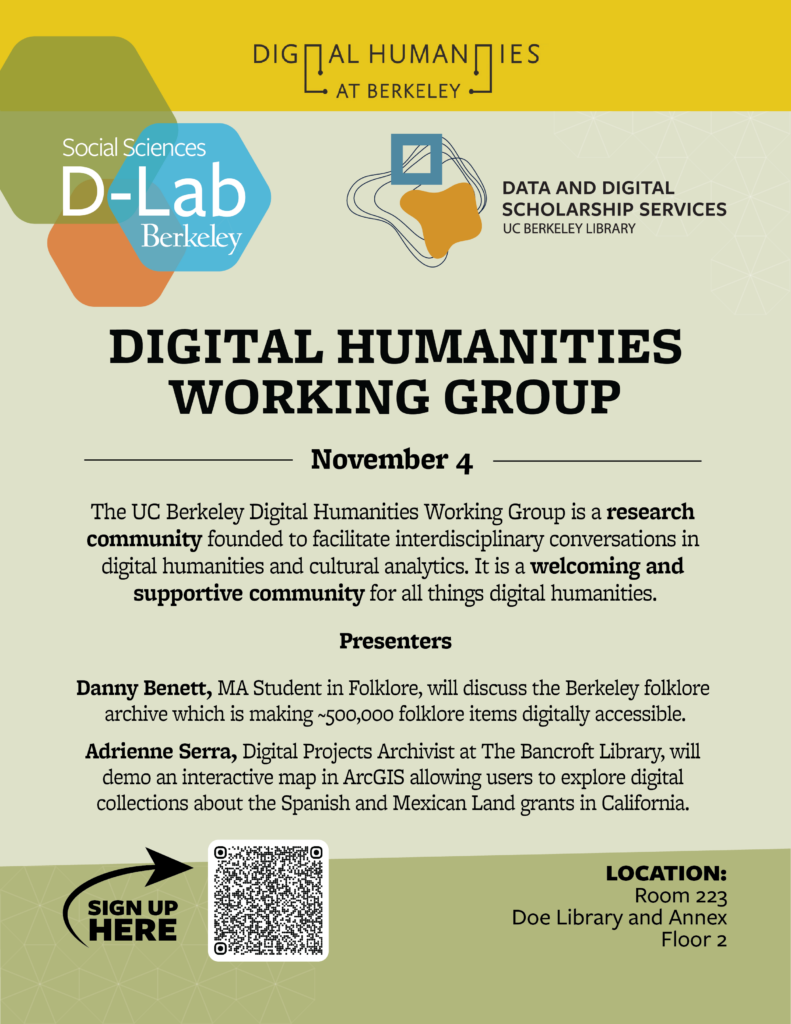
Danny Benett, MA Student in Folklore, will discuss the Berkeley folklore archive which is making ~500,000 folklore items digitally accessible.
Adrienne Serra, Digital Projects Archivist at The Bancroft Library, will demo an interactive map in ArcGIS allowing users to explore digital collections about the Spanish and Mexican Land grants in California.
We hope to see you there! Do consider signing up (link) as we order pizza and like to have loose numbers.
Flyer with D-Lab and Data & Digital Scholarship’s Digital Humanities Working Group, November 4 @ 1pm session.
The UC Berkeley Digital Humanities Working Group is a research community founded to facilitate interdisciplinary conversations in digital humanities and cultural analytics. It is a welcoming and supportive community for all things digital humanities.
The event is co-sponsored by the D-Lab and Data & Digital Scholarship Services.
This October, the Literatures community in the UC Berkeley Library wants to acknowledge that Berkeley sits on the territory of xučyun (Huichin (Hoo-Choon), the ancestral and unceded land of the Chochenyo (Cho-chen-yo) speaking Ohlone people, the successors of the historic and sovereign Verona Band of Alameda County. For more information on UC Berkeley’s stance, take a look at Centers for Educational Justice & Community Engagement’s statement on Ohlone Land.
To celebrate that history, here are a few excerpts from different California Indigenous peoples including Ohlone as well as Chowchilla- or Coast Miwok poets that this Literatures group enjoys. We encourage you to read the full poems and check out the authors’ collections.
November 1980
November
and up near Eureka
the highway has tumbled
with what may be
the last earthquake
of the year; offshore
Jade green water
chops holes in the yellow
sandstone cliff.
[…]
You plan an uncomplicated path
through Colorado’s red dust,
around the caustic edge of Utah’s salt flats
a single night at a hotel
in the Idaho panhandle. Our plans change.
It’s spring, we are two Indian women along
together and the days open:
sunrise on a fine long road,
antelope against dry hills,
heron emerging from dim fields.
You tell me this is a journey
you’ve always wanted to take.
You ask me to tell you what I want.
[…]
Standing high on this hillside
the wind off the Pacific
forming the language of grasses
and escarpment eternally speaking
the sea birds far out
on their planes of air
gather and squander
what the short days encompass
[…]
– Stephen Meadows . For full poem check out the anthology The Sound of Rattles and Clappers (UC Library Catalog) or take a look at Meadows’ recent book Winter Work (UC Library Search).
Memory Weaver
Grandmother weave me a story
The memories she pulls out of me sting like poison. Her little fingers nimbly poke the top of my scalp, as if she was carefully choosing each memory to set on top of her loom.
The silence is deafening as Grandmother Dreamweaver works on my unusual request. She is the protector of dreams, not a keeper of memories. Yet, she understands what I have asked of her.
[…]
– Yulu Ewis. For full poem, see News from Native California, Berkeley. 32,.no. 3 (Spring 2019): 24 on Ethnic News Watch. For additional poetry, take a look at Dream Weaver and the Coyote-Man’s Tale (soon to be in the UC Berkeley Library).
Last post, I promised to talk about using structured data with a dataset focused on 1950s Bay Area publishing. To get into that topic, I’m going to talk about 1) setting out with a research question as well as 2) data discovery, and 3) data organization, in order to do 4) initial mapping.
Background to my Research
When I moved to the Bay Area, I (your illustrious Literatures and Digital Humanities Librarian) started exploring UC Berkeley’s collections. I wandered through the Doe Library’s circulating collections and started talking to our Bancroft staff about the special library and archive’s foci. As expected, one of UC Berkeley’s collecting areas is California publishing, with a special emphasis on poetry.
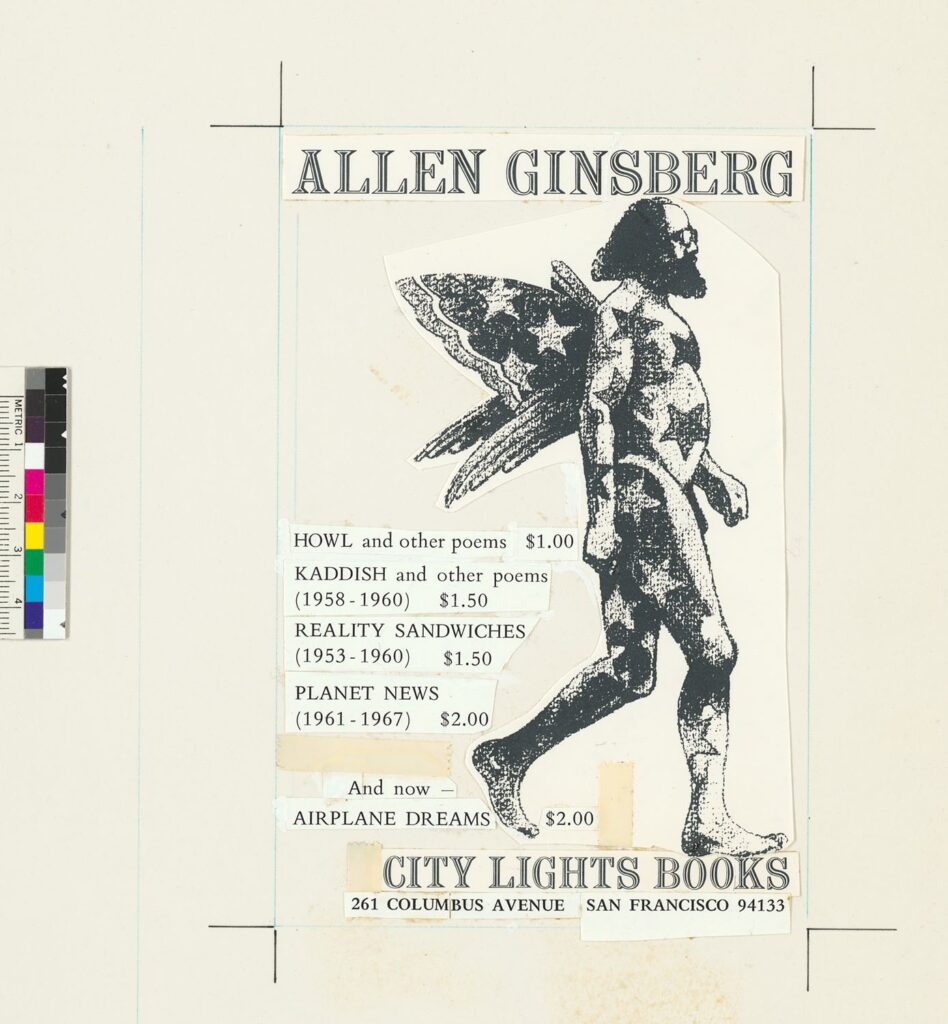
Mock-up of ad for books by Allen Ginsberg, City Lights Books Records, 1953-1970, Bancroft Library.
In fact, some of Bancroft’s oft-used materials are the City Light Books collections (link to finding aids in the Online Archive of California) that include some of Allen Ginsberg’s pre-publication drafts of “Howl” and original copies of Howl and Other Poems. You may already know about that poem because you like poetry, or because you watch everything with Daniel Radcliffe in it (IMDB on the 2013 Kill your Darlings). This is, after all, the very poem that led to the seminal trial that influenced U.S. free speech and obscenity laws (often called The Howl Obscenity Trial) . The Bancroft collections have quite a bit about that trial as well as some of Ginsberg’s correspondence with Lawrence Ferlinghetti (poet, bookstore owner, and publisher) during the harrowing legal case. (You can a 2001 discussion with Ferlinghetti on the subject here.)
Research Question
Interested in learning more about Bay Area publishing in general and the period in which Ginsberg’s book was written in particular, I decided to look into the Bay Area publishing environment during the 1950s and now (2020s), starting with the early period. I wanted a better sense of the environment in general as well as public access to books, pamphlets, and other printed material. In particular, I wanted to start with the number of publishers and where they were.
Data Discovery
For a non-digital, late 19th and 20th century era, one of the easiest places to start getting a sense of mainstream businesses is to look in city directories. There was a sweet spot in an era of mass printing and industrialization in which city directories were one of the most reliable sources of this kind of information, as the directory companies were dedicated to finding as much information as possible about what was in different urban areas and where men and businesses were located. The directories, as a guide to finding business, people, and places, were organized in a clear, columned text, highly standardized and structured in order to promote usability.
Raised in an era during which city directories were still a normal thing to have at home, I already knew these fat books existed. Correspondingly, I set forth to find copies of the directories from the 1950s when “Howl” first appeared. If I hadn’t already known, I might have reached out to my librarian to get suggestions (for you, that might be me).
I knew that some of the best places to find material like city directories were usually either a city library or a historical society. I could have gone straight to the San Francisco Public Library’s website to see if they had the directories, but I decided to go to Google (i.e., a giant web index) and search for (historic san francisco city directories). That search took me straight to the SFPL’s San Francisco City Directories Online (link here).
On the site, I selected the volumes I was interested in, starting with Polk’s Directory for 1955-56. The SFPL pages shot me over to the Internet Archive and I downloaded the volumes I wanted from there.
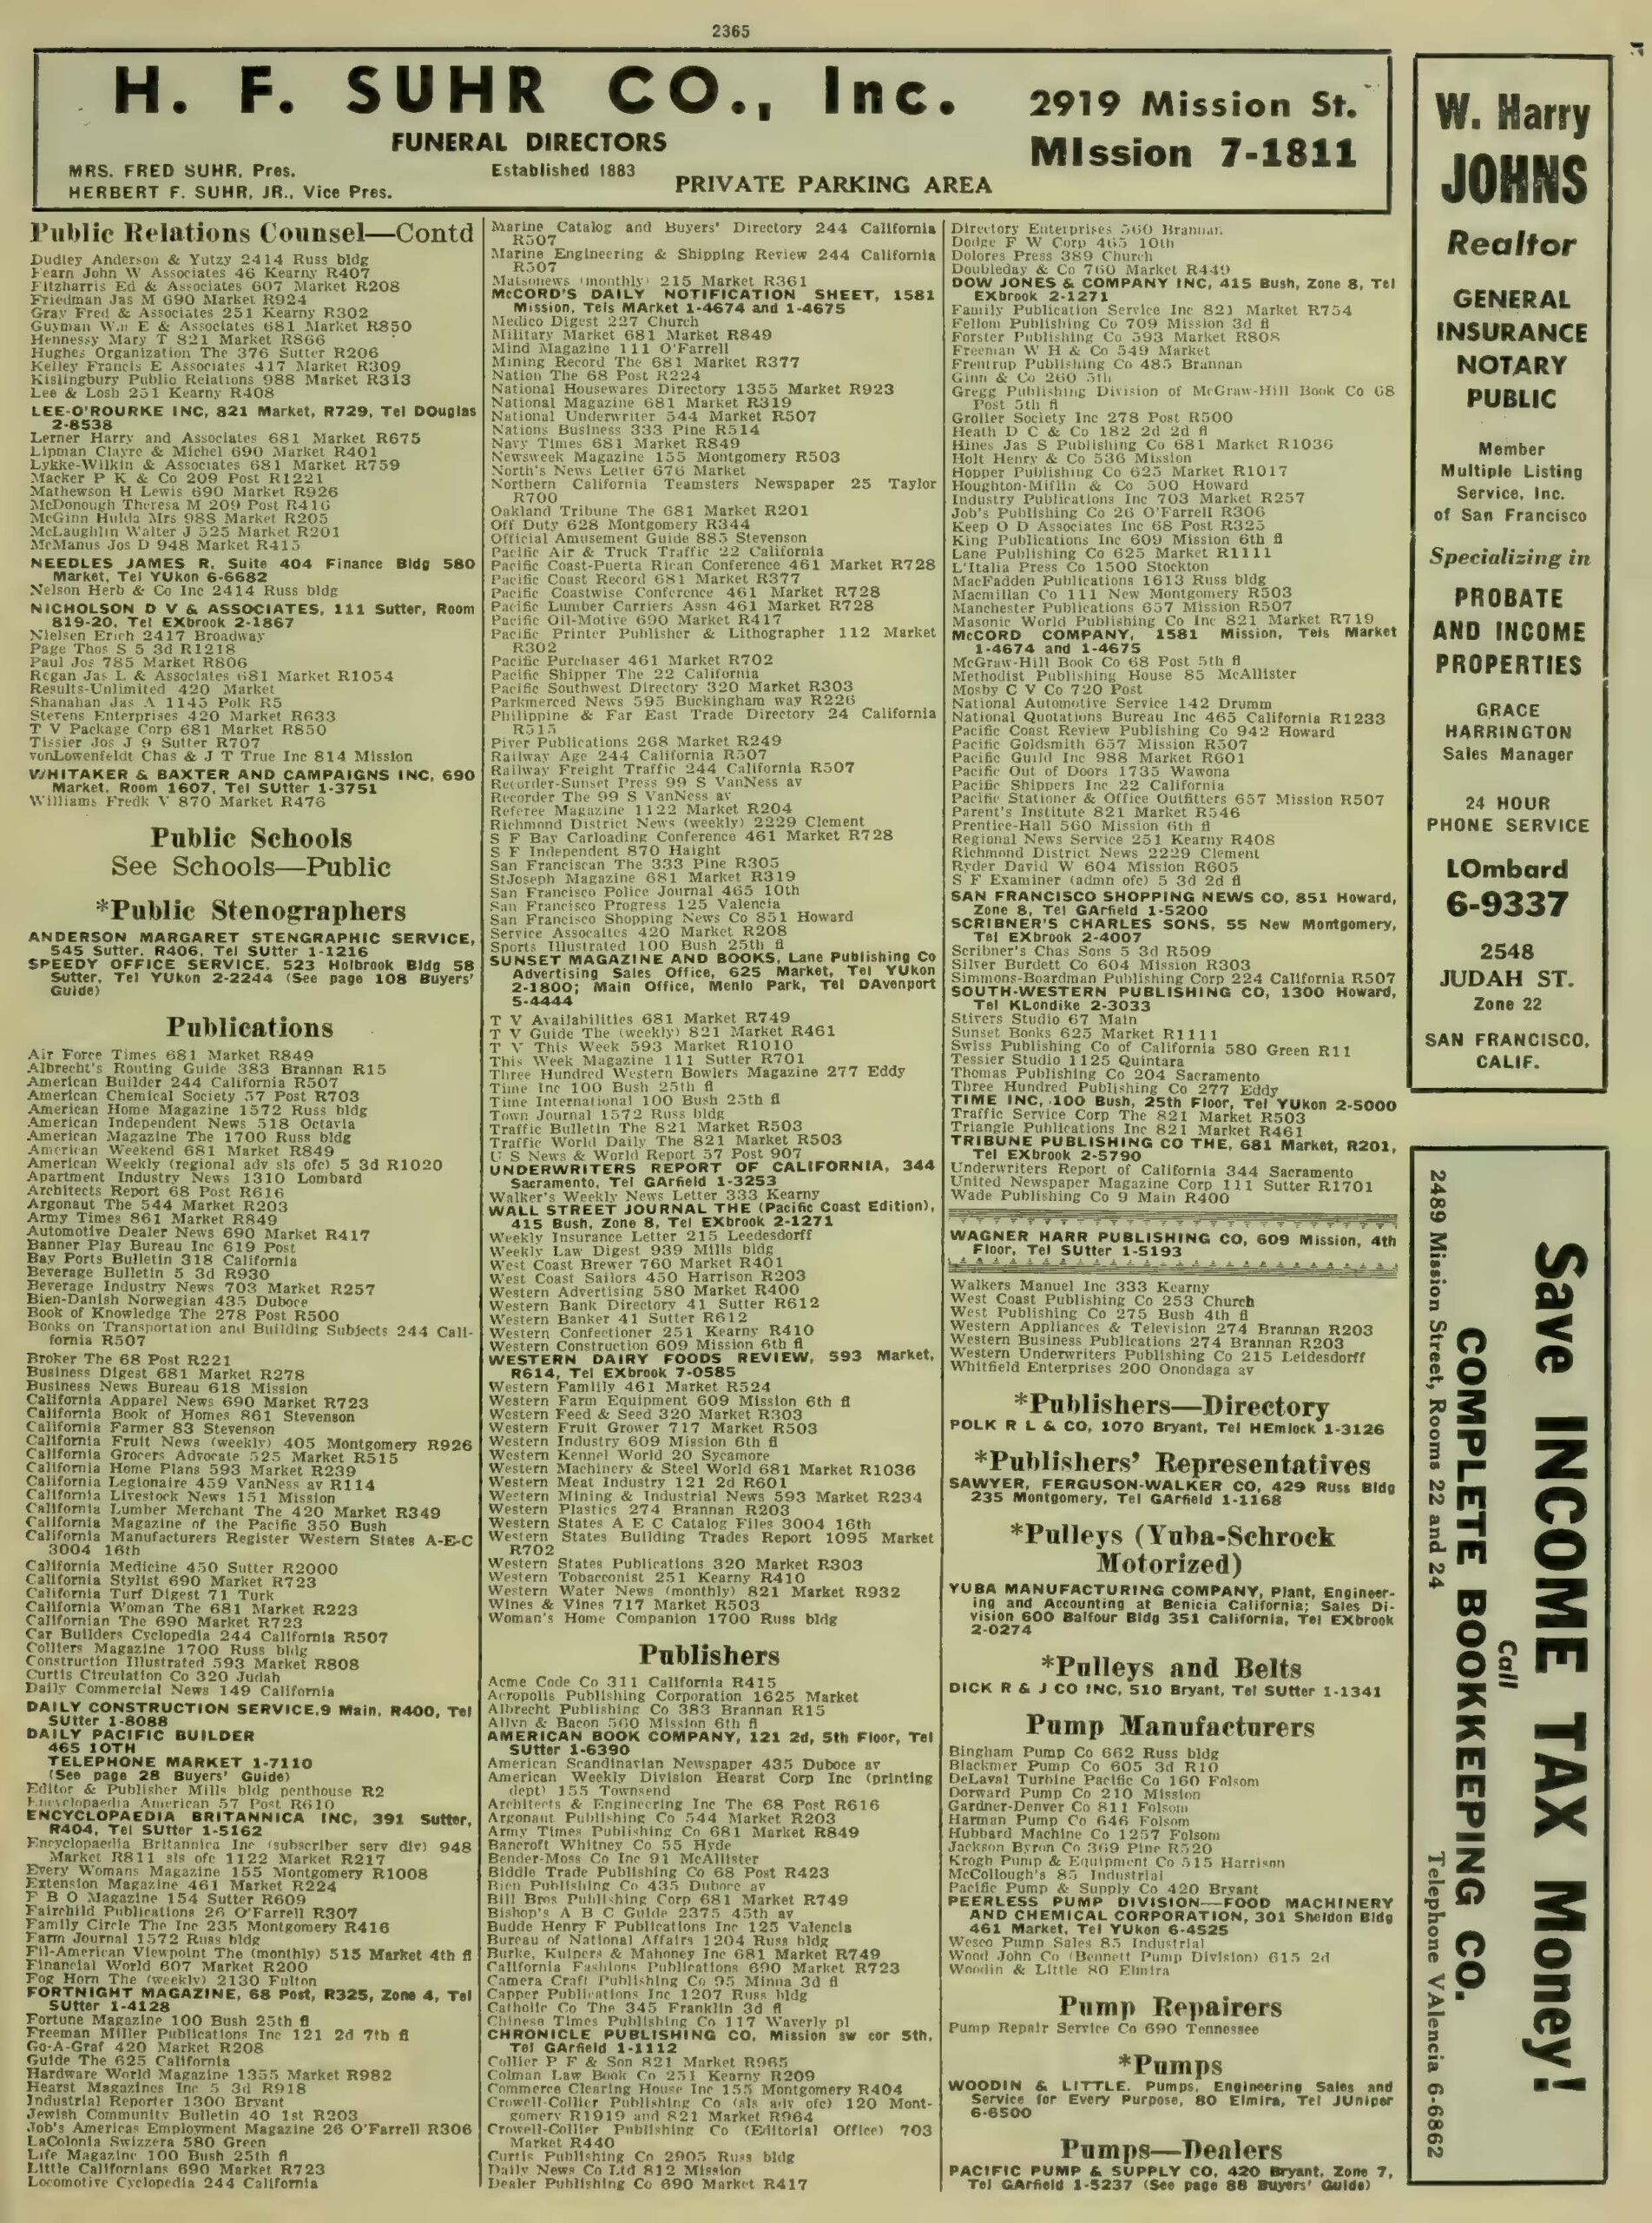
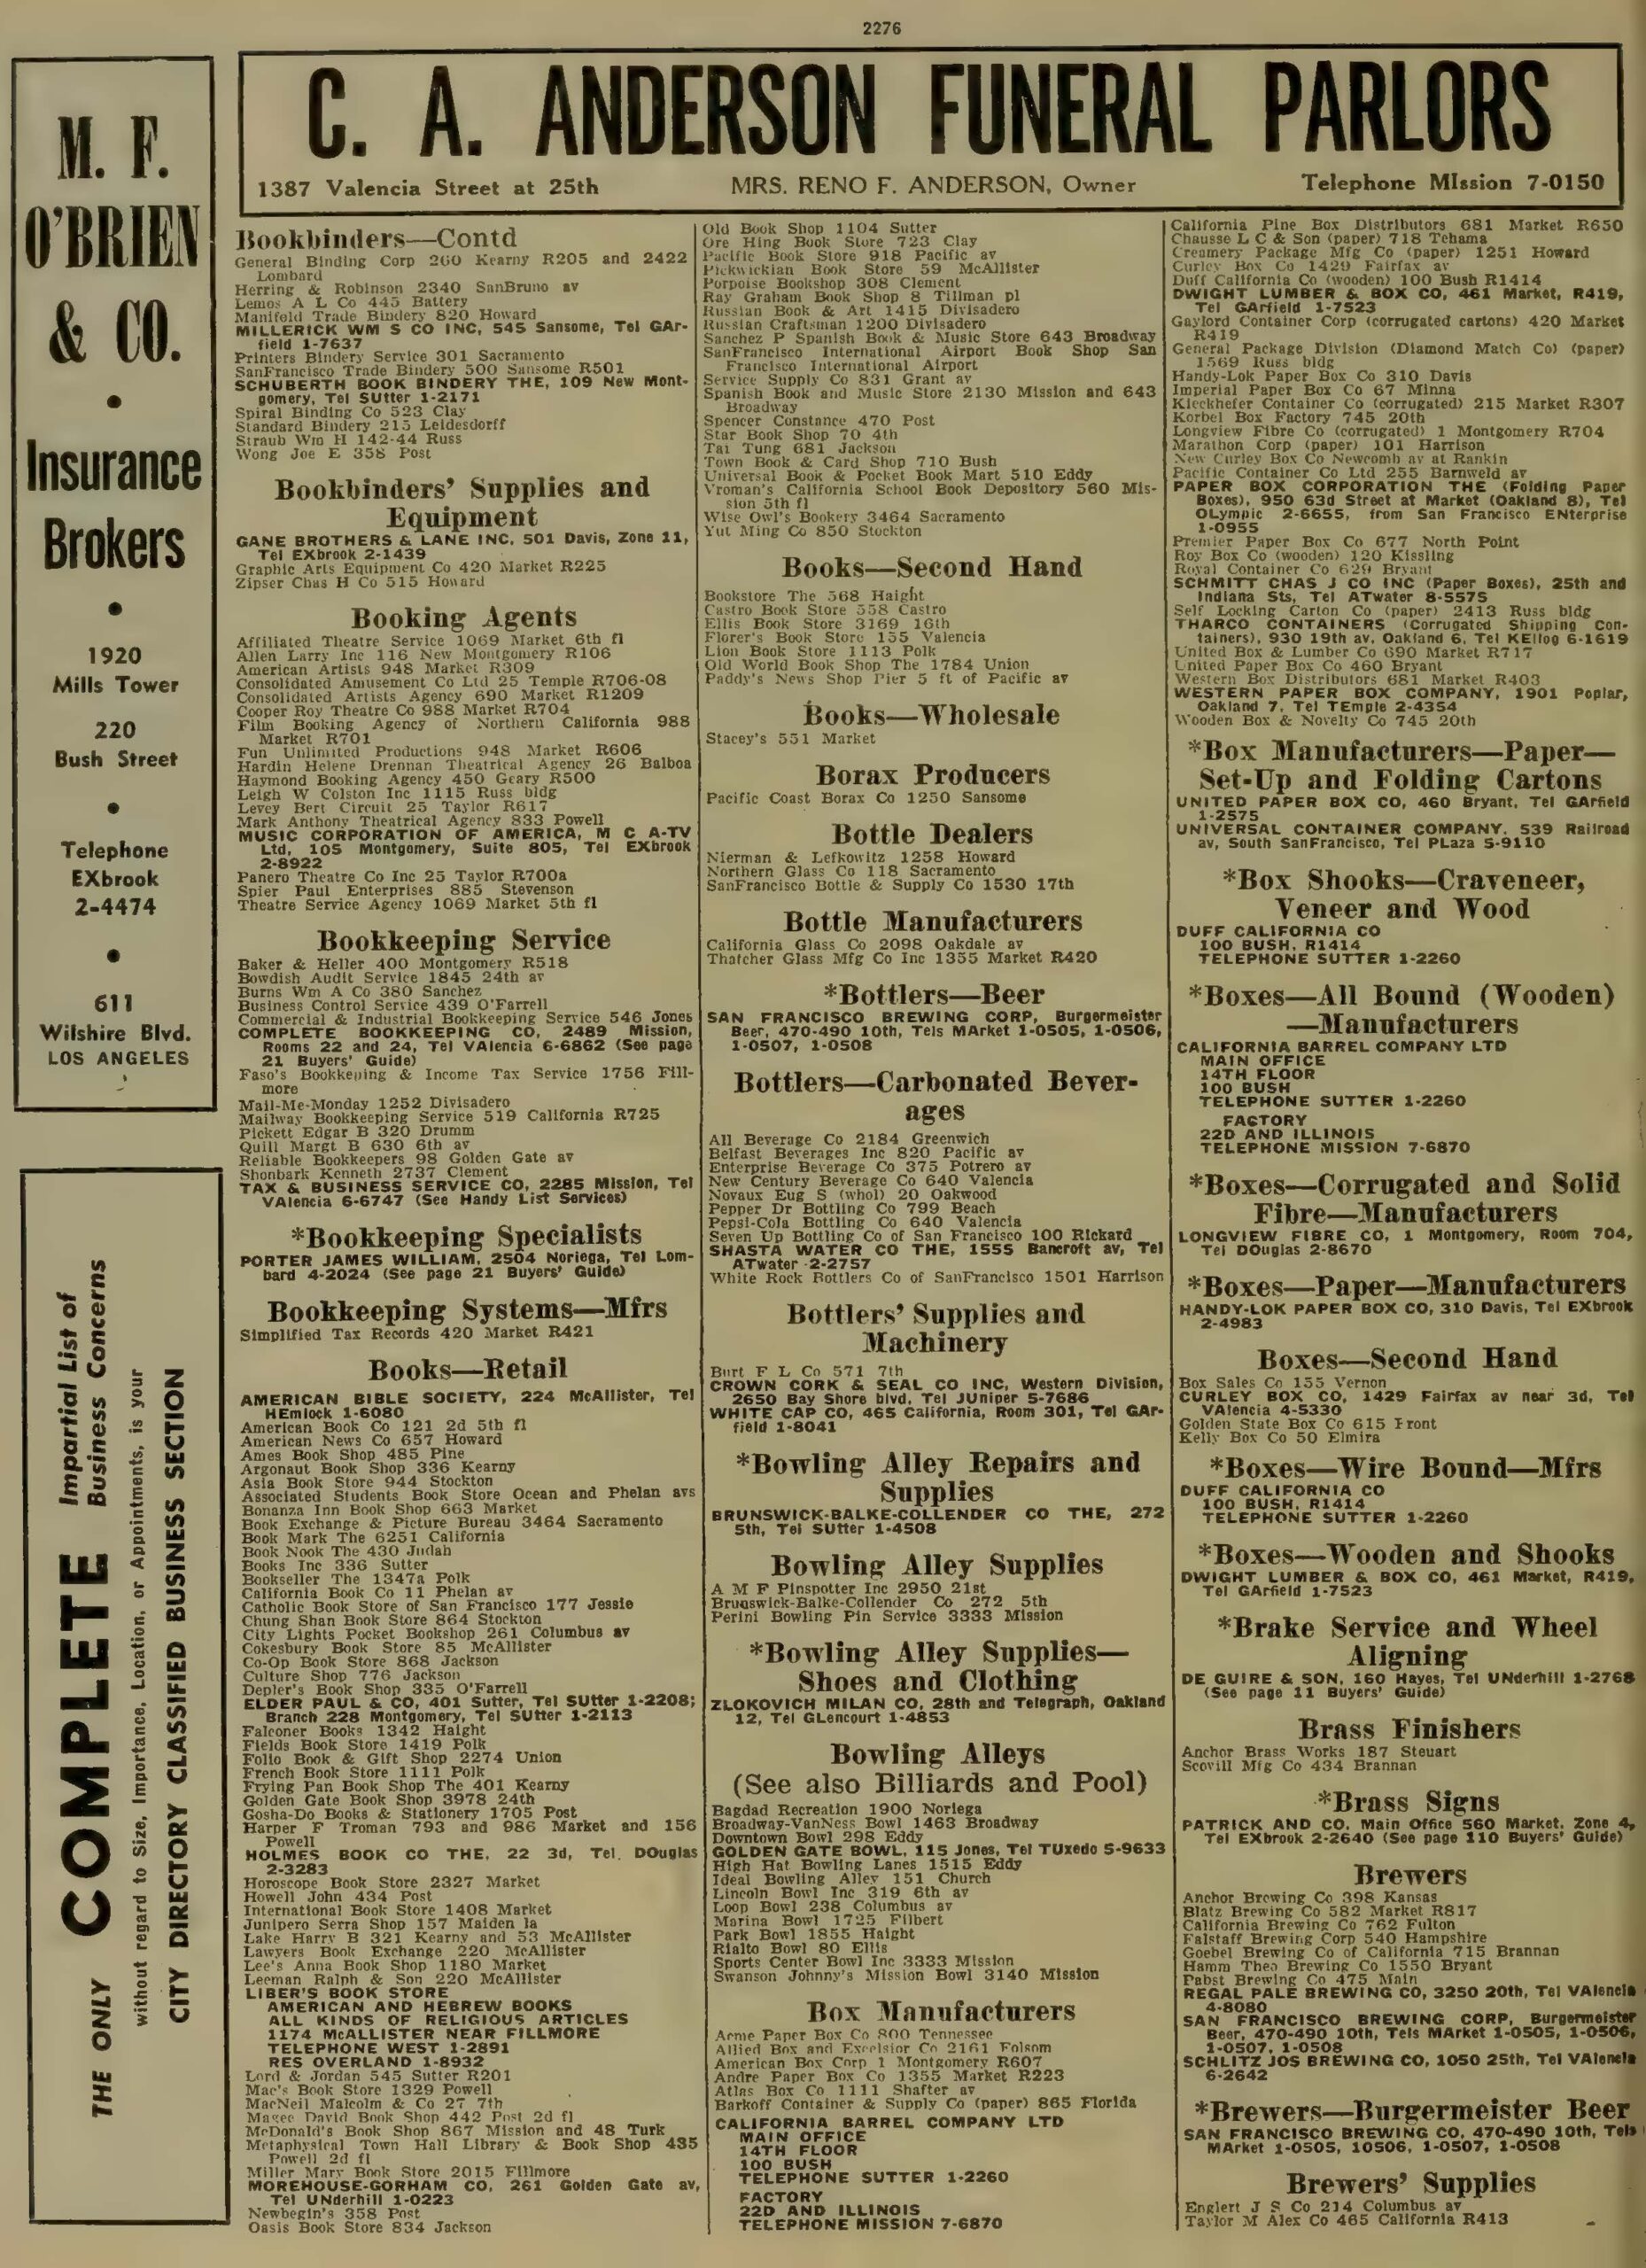
Once the directory was on my computer, I opened it and took a look through the “yellow pages” (i.e., pages with information sorted by business type) for “publishers.”
Note the dense columns of text almost overlap. From R.L. Polk & Co, Polk’s San Francisco City Directory, vol. 1955–1956 (San Francisco, Calif. : R.L. Polk & Co., 1955), Internet Archive. | Public Domain.
Glancing through the listings, I noted that the records for “publishers” did not list City Light Books. Flipped back to “book sellers,” I found it. That meant that other booksellers could be publishers as well. And, regardless, those booksellers were spaces where an audience could acquire books (shocker!) and therefore relevant. Considering the issue, I also looked at the list for “printers,” in part to capture some of the self-publishing spaces.
I now had three structured lists from one directory with dozens of names. Yet, the distances within the book and inability to reorganize made them difficult to consider together. Furthermore, I couldn’t map them with the structure available in the directory. In order to do what I wanted with them (i.e., meet my research goals), I needed to transform them into a machine readable data set.
Creating a Data Set
Machine Readable
I started by doing a one-to-one copy. I took the three lists published in the directory and ran OCR across them in Adobe Acrobat Professional (UC Berkeley has a subscription; for OA access I recommend Transkribus or Tesseract), and then copied the relevant columns into a Word document.
Data Cleaning
The OCR copy of the list was a horrifying mess with misspellings, cut-off words, Ss understood as 8s, and more. Because this was a relatively small amount of data, I took the time to clean the text manually. Specifically, I corrected typos and then set up the text to work with in Excel (Google Sheets would have also worked) by:
creating line breaks between entries,
putting tabs between the name of each institution and corresponding address
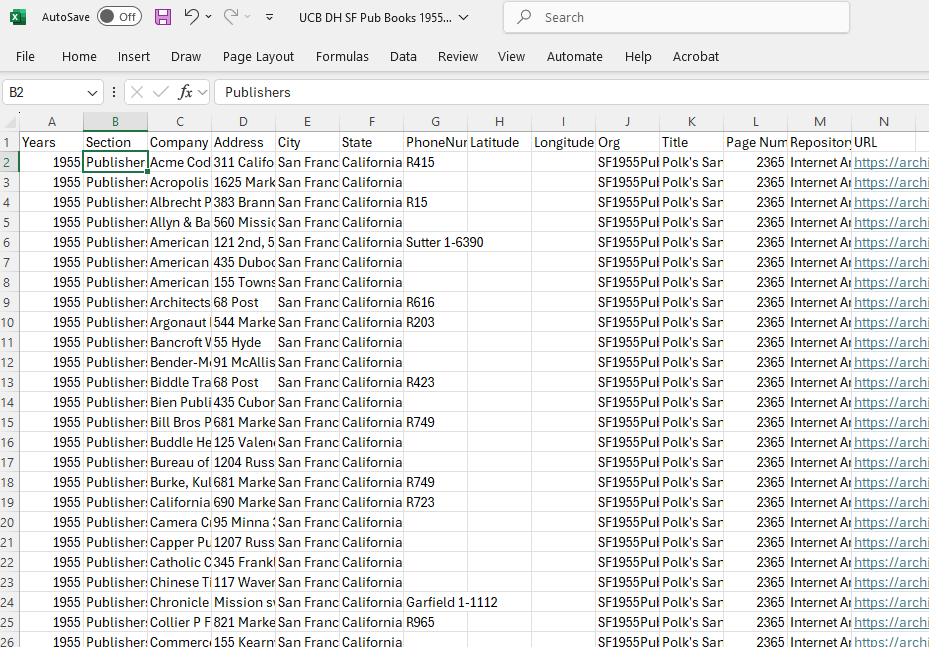
Once I’d cleaned the data, I copied the text into Excel. The line breaks functioned to tell Excel where to break rows and the tabs where to understand columns. Meaning:
Each institution had its own row.
The names of the institutions and their addresses were in different columns.
Having that information in different spaces would allow me to sort the material either by address or back to its original organization by company name.
Adding Additional Information
I had, however, three different types of institutions—Booksellers, Printers, and Publishers—that I wanted to be able to keep separate. With that in mind, I added a column for EntryType (written as one word because many programs have issues with understanding column headers with spaces) and put the original directory headings into the relevant rows.
Knowing that I also wanted to map the data, I also added a column for “City” and another for “State” as the GIS (i.e., mapping) programs I planned to use wouldn’t automatically know which urban areas I meant. For these, I wrote the name of the city (i.e., “San Francisco”) and then the state (i.e., “California”) in their respective columns and autofilled the information.
Next, for record keeping purposes, I added columns for where I got the information, the page I got it from, and the URL for where I downloaded it. That information simultaneously served for me as a reminder but also as a pointer for anyone else who might want to look at the data and see the source directly.
I put in a column for Org/ID for later, comparative use (I’ll talk more about this one in a further post,) and then added columns for Latitude and Longitude for eventual use.
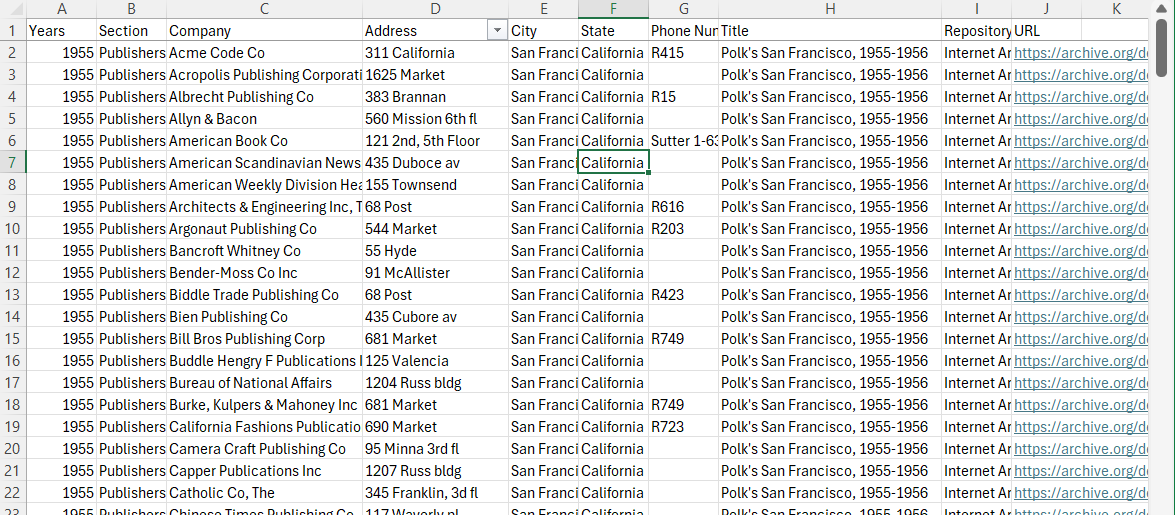
The column headers here are: Years; Section; Company; Address; City; State; PhoneNumber; Latitude; Longitude; Org; Title; PageNumber; Repository; URL. Click on the chart to see the file.
Finally, I saved my data with a filename that I could easily use to find the data again. In this case, I named it “BayAreaPublishers1955.” I made sure to save the data as an Excel file (i.e., .xmlx) and Comma Separated Value file (i.e., .csv) for use and preservation respectively. I also uploaded the file into Google Drive as a Google Sheet so you could look at it.
Initial Mapping of the Data
With that clean dataset, I headed over to Google’s My Maps (mymaps.google.com) to see if my dataset looked good and didn’t show locations in Los Angeles or other spaces. I chose Google Maps for my test because it is one of the easiest GIS programs to use
because many people are already used to the Google interface
the program will look up latitude and longitude based on address
it’s one of the most restrictive, meaning users don’t get overwhelmed with options.
Heading to the My Maps program, I created a “new” map by clicking the “Create a new map” icon in the upper, left hand corner of the interface.
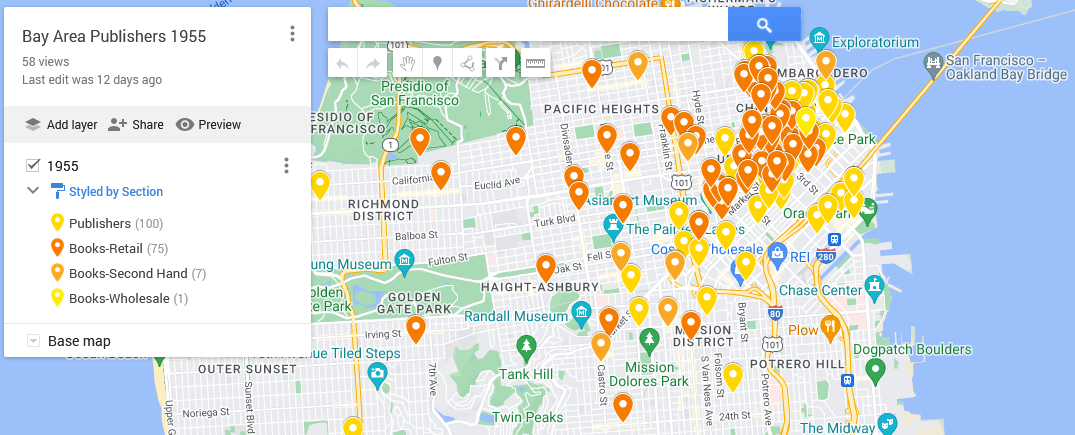
From there, I uploaded my CSV file as a layer. Take a look at the resulting map:
Click on the map for an interactive version. Note that I’ve set the pins to differ in column by “type.”
The visualization highlights the centrality of the 1955 San Francisco publishing world, with its concentration of publishing companies and bookstores around Mission Street. Buying books also necessitated going downtown, but once there, there was a world of information at one’s fingertips.
Add in information gleaned from scholarship and other sources about book imports, custom houses, and post offices, and one can start to think about international book trades and how San Francisco was hooked into it.
I’ll talk more about how to use Google’s My Maps in the next post in two weeks!
This is the first of a multi-part series exploring the idea and use of data in the Arts & Humanities. For more information, check out the UC Berkeley Library’s Data and Digital Scholarship page.
Arts & Humanities researchers work with data constantly. But, what is it?
Part of the trick in talking about “data” in regards to the humanities is that we are already working with it. The books and letters (including the one below) one reads are data, as are the pictures we look at and the videos we watch. In short, arts and humanities researchers are already analyzing data for the essays, articles, and books that they write. Furthermore, the resulting scholarship is data.
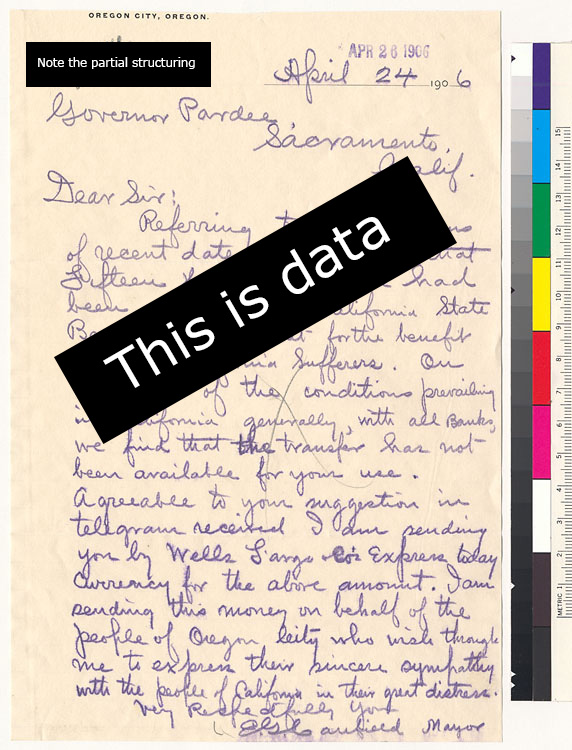
For example, the letter below from Bancroft Library’s 1906 San Francisco Earthquake and Fire Digital Collection on Calisphere is data.
George Cooper Pardee, “Aid for San Francisco: Letter from the Mayor in Oregon,”
April 24, 1906, UC Berkeley, Bancroft Library on Calisphere.
One ends up with the question “what isn’t data?”
The broad nature of what “data” is means that instead of asking if something is data, it can be more useful to think about what kind of data one is working with. After all, scholars work with geographic information; metadata (e.g., data about data); publishing statistics; and photographs differently.
Another helpful question is to consider how structured it is. In particular, you should pay attention to whether the data is:
unstructured
semi-structured
structured
The level of structure informs us how to treat the data before we analyze it. If, for example, you have hundreds of of images, you want to work with, it’s likely you’ll have to do significant amount of work before you can analyze your data because most photographs are unstructured.
For example, with this picture of a ceramic hedgehog, the adorable animal, the photograph, and the metadata for the photograph are all different kinds of data. Image: Zde, Ceramic Rhyton in the Form of a Hedgehog, 14. to 13. century BCE, Photograph, March 15, 2014, Wikimedia Commons. | Creative CommonsAttribution-Share Alike 3.0 Unported.
In contrast, the letter toward the top of this post is semi-structured. It is laid out in a typical, physical letter style with information about who, where, when, and what was involved. Each piece of information, in turn, is placed in standardized locations for easy consumption and analysis. Still, to work with the letter and its fellows online, one would likely want to create a structured counterpart.
Finally, structured data is usually highly organized and, when online, often in machine-readable chart form. Here, for example, are two pages from the Polk San Francisco City Directory from 1955-1956 with a screenshot of the machine-readable chart from a CSV (comma separated value) file below it. This data is clearly structured in both forms. One could argue that they must be as the entire point of a directory is for easy of information access and reading. The latter, however, is the one that we can use in different programs on our computers.
R.L. Polk & Co, Polk’s San Francisco City Directory, vol. 1955–1956 (San Francisco, Calif. : R.L. Polk & Co., 1955), Internet Archive. | Public Domain.
This post has provided a quick look at what data is for the Arts&Humanities.
The next will be looking at what we can do with machine-readable, structured data sets like the publisher’s information. Stay tuned! The post should be up in two weeks.
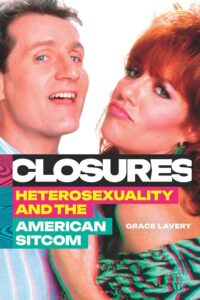
To my delight, I get to announce that Prof. Grace Lavery has a new book titled Closures: Heterosexuality and the American Sitcom (cover figured here).
At UC Berkeley, Lavery teaches courses (course catalog) on topics such as “Literature and Popular Culture” as well as special topics courses and research seminars examining representations of sex, sexuality, and gender.
Lavery’s new book is a phenomenal study looking at the idea of heterosexuality in the U.S. American sitcom. More specifically, the book “reconsiders the seven-decade history of the American sitcom to show how its reliance on crisis and resolution in each episode creates doubts and ambivalence that depicts heterosexuality as constantly on the verge of collapse and reconstitution.”
You can access and download the book online through the UC Library Search.
It’s an election year. If you haven’t registered to vote yet, there’s still time! In California, you need to be registered at least 15 days before Election Day (this year that’s Tuesday, November 5). You can click on the link to the right to register.
As a quick reminder, there are two criteria to register. First (legal status), you must be a United States citizen and a resident of California. Second (age), you must be 18 years old or older on Election Day. You do not need a California state identification to register.
Once you register, you will be able to either vote by mailor at the polls on election day. Click on the link to the right to find out more information or to watch a video about how the process works.
If you aren’t from this state, be aware that California residents vote on multiple propositions alongside United States president. You can request an Official Voter Information Guide from the State which will contain a short blurb with pros/cons on each item for consideration. You can also choose to take a look at what will (probably) be on the ballot on Ballotpedia. Those propositions will include things like Mental Health Services; the right to marry; involuntary servitude; and more.
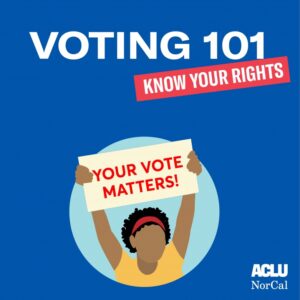
If you’re wanting to learn more about voting as a right, consider looking at this ACLU Voting 101 Toolkit:
Find the Voting 101 Toolkit on the ACLU’s website (click on image).
Mrs. Dalloway’s Literary and Garden Arts (website) got there first, nonetheless I’m thrilled to share the news that Prof. Elizabeth Abel released Odd Affinities : Virginia Woolf’s Shadow Genealogies with the University of Chicago Press this year.
Abel’s Odd Affinities (2024).
Prof. Abel (faculty page) teaches with the UC Berkeley English Department. They teach courses on Woolf and the Bloomsbury Group as well as broader overviews of 19th and 20th century English literatures. This fall, they are leading courses “Memoir and Memory” as well as on graduate readings and special study.
In Odd Affinities, Prof. Abel discusses Woolf’s influence beyond a female tradition, looking at echoes of Woolf work in four major writers from diverse cultural contexts: Nella Larsen, James Baldwin, Roland Barthes, and W. G. Sebald. Looking at those “odd affinities,” Abel looks at how “Woolf’s career and the transnational modernist genealogy was constituted by her elusive and shifting presence.”
You can access Abel’s book through the UC Library Search, where you can access it online and download the fulltext.
To my delight, the Booker Prize longlist has been announced! I’m rather looking forward to a couple long weekends reading through these.
For the list, I’ve gone ahead and included the Booker Prizes’ official links for title and authors as well then a UC Search or Berkeley Public Library link in the parenthesis.


 This year’s short list for the Caine Prize for African Writing is rather phenomenal. Here’s the list with access to most of the stories full text:
 To my delight, I get to announce that Prof. Grace Lavery has a new book titled Closures: Heterosexuality and the American Sitcom (cover figured here).