Tag: metrics
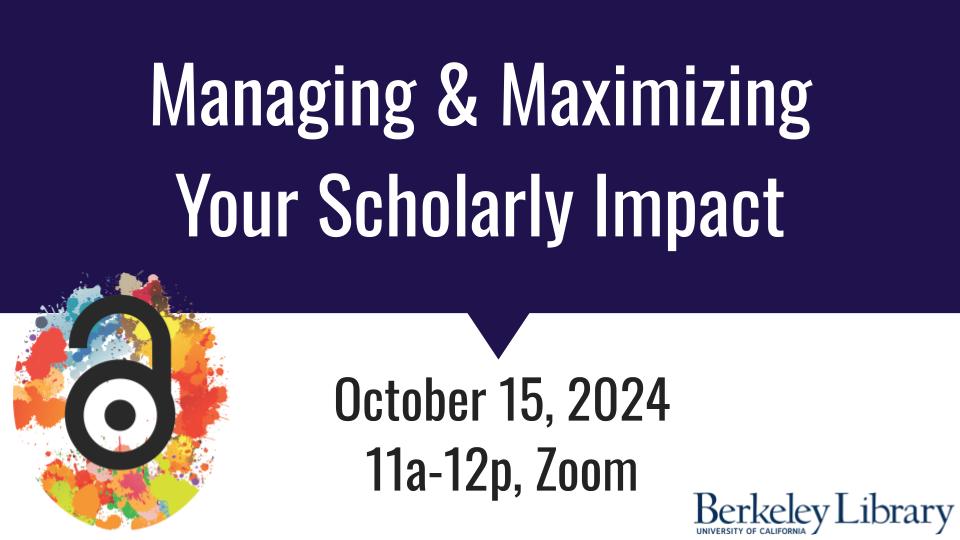
Workshop reminder — Managing & Maximizing Your Scholarly Impact
Date/Time: Tuesday, October 15, 2024, 11:00am–12:00pm
Location: Zoom. RSVP.
This workshop will provide you with practical strategies and tips for promoting your scholarship, increasing your citations, and monitoring your success. You’ll also learn how to understand metrics, use scholarly networking tools, and evaluate journals and publishing options.
Workshop Reminder — Managing & Maximizing Your Scholarly Impact on October 10, 2023
Date/Time: Tuesday, October 10, 2023, 11:00am–12:30pm
Location: Hybrid: Join in person at 223 Doe Library, or on Zoom. Register via LibCal.
This workshop will provide you with practical strategies and tips for promoting your scholarship, increasing your citations, and monitoring your success. You’ll also learn how to understand metrics, use scholarly networking tools, evaluate journals and publishing options, and take advantage of funding opportunities for Open Access scholarship.
Join us next week!
Who uses what libraries?
Lynne Grigsby and Susan Edwards conceived (as part of the Library Service Model re-envisioning look at access) of a set of reports that show
* how many items are in circulation at the moment of snapshot
* what libraries checked out these items
* whether the items are checked out to faculty, graduate students or undergrads
* what academic department a faculty or student borrower is affiliated with. (Note: this is determined by the campus address for faculty, and declared major for graduate and undergraduate students).
Every other month, Dave Rez in Systems will run 3 reports (items in circulation, at the moment of snapshot, to faculty, grads, undergrads) and post them to http://digitalassets.lib.berkeley.edu/annual_statistics/circ_snapshots/ . Pilot reports were run for faculty and grad students based on a day in March; these reports were then refined for the May run and include undergrad information. A link to these reports has been included in /CS on the Budget/Metrics page.
I’ve already found these statistics to be fascinating: we now have a metric to help quantify our anecdotal understanding that “research is highly interdisciplinary” and that “each of our libraries services users from a myriad of academic departments.” It will be very interesting to see if the patterns in March/May continue as we are looking at longer stretches of time.
Gail is working with the May statistics and we’ll release some findings in the next month or so. From here on, any of you will be able to access and consider this data for your libraries.
Thanks to Susan and Lynne for this great idea, and to Dave Rez for making this happen!
–Bernie