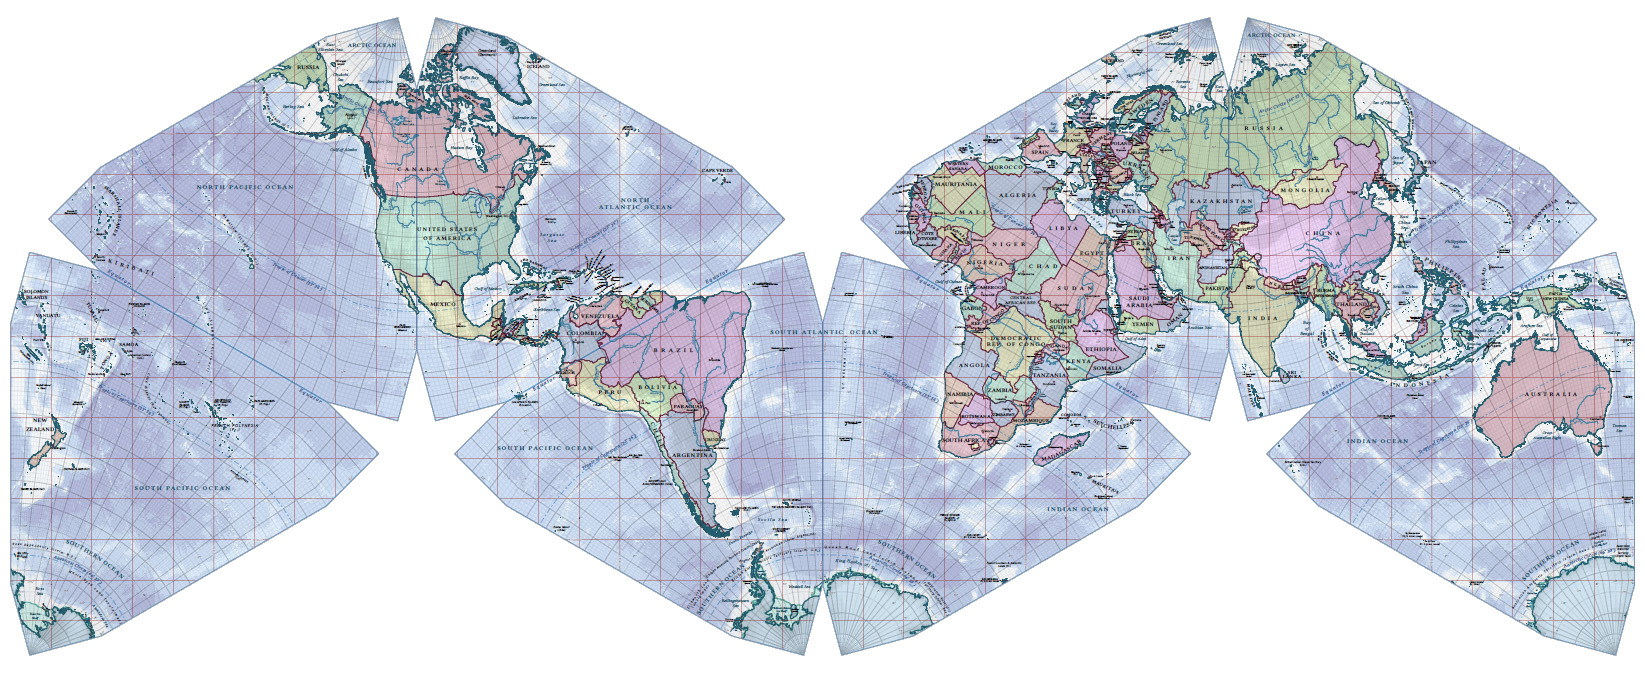
You probably love maps (who doesn’t?!). They can be beautiful, visually compelling, interesting representations of the world. You might have one hanging on your wall, laugh over one showing how Oakland was the new Brooklyn even back in 1888, or exclaim over one (my new favorite) showing bear concentrations in Norway.
These same qualities that make us love maps are also why they can be excellent research tools. Even if you are not a geographer or urban planner you can use maps to provide context for a place you are describing, explore spatial relationships, or visualize your data in a way that highlights new patterns. For example, a music student used and made maps to trace the locations of 19th century Parisian opera goers!
In addition to the approximately half-a-million physical maps and air photos in the UC Berkeley Library’s collections, the library subscribes to several online databases that let you explore demographic data and create maps that you can share online or print. SimplyMap, Social Explorer, and Policy Map all cover the United States. If you are interested in China, the China Geo-Explorer II database has mappable census data.
There are also many freely available resources available online. My standby is Old Maps Online, which pulls together scanned maps from institutions around the world into a single search screen. Just zoom in to your area of the world, adjust the time slider, and explore!
What if you want to make a map with your own data? There are many good options for that, too, including ArcGIS Online (a library subscribed resource), CartoDB, MapBox, and Google, among others.
Contact Susan Powell, GIS & Map Librarian, at smpowell[at]berkeley.edu if you’d like to find out more about how you can use maps — both print and digital — in your research. Or stop by the Earth Sciences & Map Library to explore the collection and find out more!

