At the Earth Sciences and Map Library staff, students, and faculty have access to fantastic mapping resources. The library has resources for topographic maps, geologic maps, historical maps, sanborn & other fire insurance maps, nautical maps, and GIS data. Out of all the resources, one of the most fun to use is ArcGIS StoryMaps. To access StoryMaps with your CalNet ID, you want to access it through your institutional account. Go to http://cal.maps.arcgis.com and click on the link to login using your UC Berkeley Calnet account. If you do not have a CalNet ID you can access StoryMaps with an ArcGIS Public Account.
![View from the university ground [sic] at Berkeley, 1874](https://update.lib.berkeley.edu/wp-content/uploads/2020/12/View-from-the-university-ground-sic-at-Berkeley-the-Golden-Gate-in-the-distance-300x266.jpg)
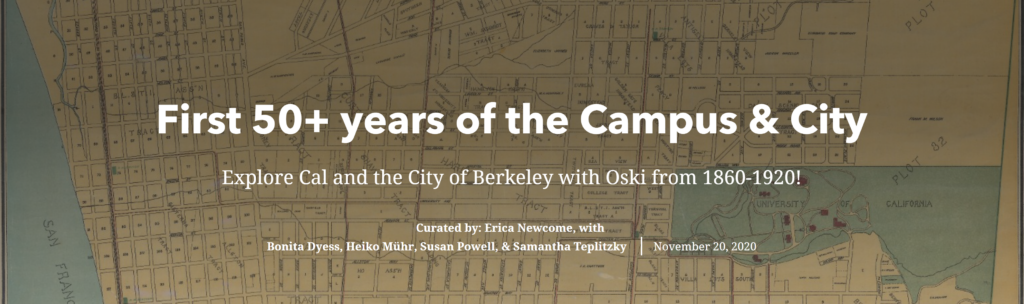
This November, the Earth Sciences and Map Library created an exhibit using StoryMaps titled First 50+ years of the Campus & City. StoryMaps allows you to do just as the title tells you, create stories with maps. You can add maps, text, images, and multimedia to tell your unique narrative. Staff of the Earth Sciences and Map Library were able to create an interactive story that showed how the campus and city changed over time from the founding of the UC Berkeley campus in 1868 to 1920 when the city and campus had greatly expanded over 50+ years.
 One of the most powerful components of StoryMaps is its interface that allows the creator to make an exhibit that is highly interactive. In the exhibit for the Earth Sciences and Map Library, there is an app called swipe which allows a creator to place two maps side by side which users can then swipe left to right to compare the maps. This tool was added to the exhibit for the Earth Sciences and Map Library using two maps of the UC Berkeley campus from 1901 and 1911. Users are able to swipe left and right to see the differences between the two maps that show the changes campus underwent in a ten year span. The ability to have these types of interactive and comparative maps allows users to learn visually the differences and similarities between 2 maps.
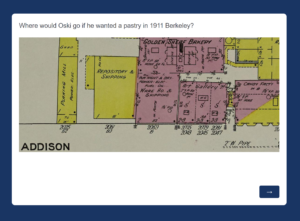
StoryMaps also has the capability to insert embedded code. This allowed the exhibit to have Qualtrics embedded. In the exhibit from the Earth Sciences and Map Library, Qualtrics was embedded and created to be a game that asks users to click on a map to answer related questions to old buildings. With the embedded Qualtrics the exhibit incorporated play into its story to engage users and added a bit of fun to its narrative. One thing to note when embedding code in StoryMaps is to double check that you have inserted the correct code. When creating the exhibit the Earth Sciences and Map Library staff learned the hard way that when code is entered incorrectly, it will cause StoryMaps to crash.
Another important feature of StoryMaps is creating groups on ArcGIS Online. This feature helped immensely when creating an exhibit for the Earth Sciences and Map Library. By having StoryMaps added to the group, all staff members of the library were able to edit the exhibit. This group sharing ability allows for large groups to easily collaborate virtually.
After our own positive experience creating an exhibit using StoryMaps for the Earth Sciences and Map Library, we highly recommend using it if you want to create an interactive experience for users by telling a story with maps. StoryMaps would be great for an exhibit, project, or presentation whether that be for an academic class, a professional presentation, or a library. There are so many features and tools with StoryMaps you can use to bring your maps to life!